Free Data Sheets for Behavior IEP Collection
Wanna skip right to the good stuff? I got ya. Throw in your name and email address (make sure it’s your personal one, not your school one) and I will send you your free resource, a scatterplot for helping your record behavior data.
But if you need a little bit more information about how to get some meaningful data with by using this scatterplot, let’s dig in.
As special education teachers, it can feel like tracking behavior data for IEPs is a full-time job in itself. You’re juggling so many responsibilities—teaching, managing behaviors, attending meetings—that it’s easy for data collection to feel overwhelming. But let’s be real: consistent and accurate data is the foundation of effective behavior plans and will help us celebrate when we meet the behavior goals. It’s what helps us show progress (or identify where adjustments are needed) and keeps us grounded in facts when discussing a student’s needs with the team.
OVERLOADED caseload? No idea how you are going to manage it all? This Summit is for you.

calling all SPED Teachers
OVERLOADED caseload? No idea how you are going to manage it all? This Summit is for you.
That’s why I’ve created a free behavior IEP data sheet to make your life easier! This tool is specifically a scatterplot tool that is designed to make your data collection easier, because it is easier to collect then it is more likely you (and your team will actually collect it!)
What Is a Scatterplot for Behavior Data?
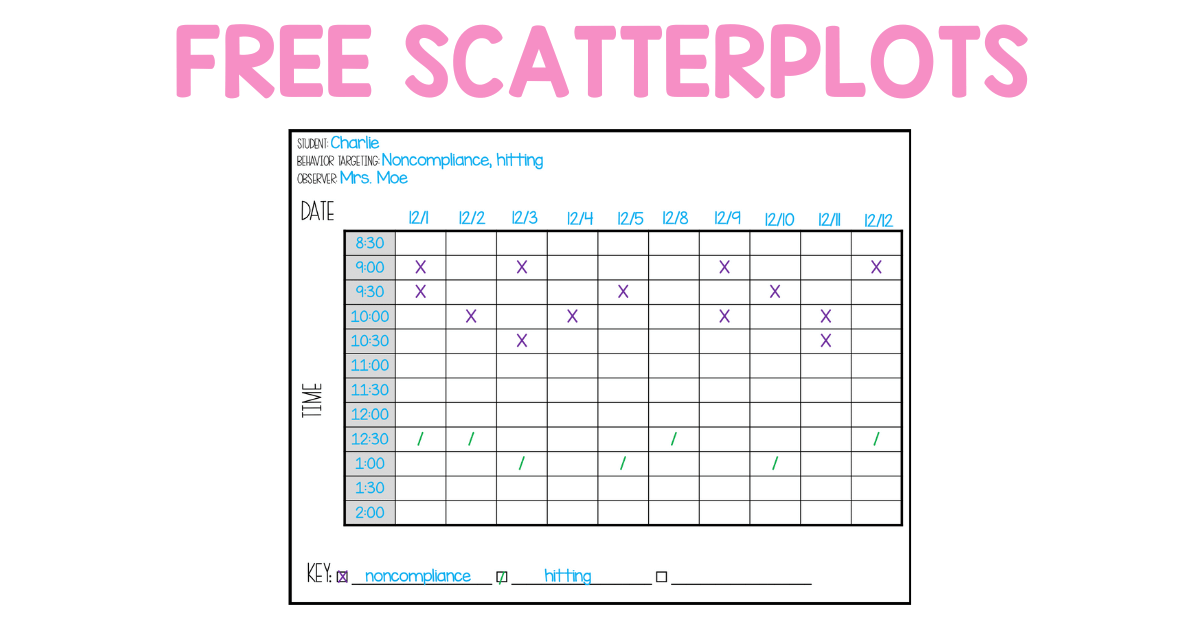
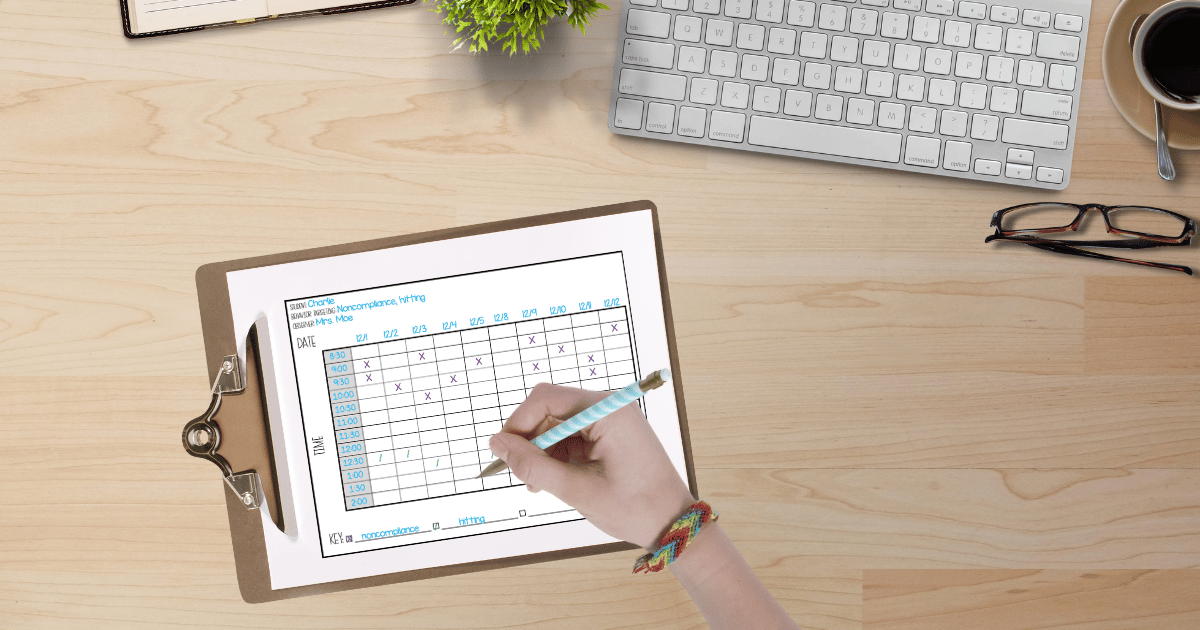
A scatterplot for behavior data is a simple visual tool designed to help you identify patterns in student behavior. Unlike lengthy observation logs or anecdotal notes, a scatterplot gives you a quick, visual way to track when and where behaviors occur throughout the day. It allows for quick analysis of students’ progress and the ability to see trends in student behaviors.
Here’s how it works: you use a grid to mark the occurrence of specific behaviors during different times of the day or in various settings. You can do a scatterplot for a week, two weeks or a month. Yup, one sheet for the entire month.
Over time, these marks will reveal trends—like whether a student’s behaviors spike during transitions, specific subjects, or after lunch.
For example, imagine a student frequently has outbursts during math class. By using a scatterplot, you might notice that these behaviors only happen on days when math occurs right after recess. With this insight, you can address the root cause—perhaps by building in a calming activity after recess or adjusting the structure of math time.
A scatterplot is an especially useful data collection method for IEP teams because they make it easy to share clear, objective data with everyone involved. It is a user-friendly tool that makes it easy to use for special ed and general education teachers.
Convince you yet? Perfecf- type in your name and I will send you the editable data sheets now!
The Pros and Cons of Using a Scatterplot for Behavior Data
When it comes to tracking behavior data, scatterplots are a fantastic tool, but like any other data collection forms, they come with their strengths and limitations. Here’s a quick breakdown to help you decide if this tool is right for your classroom or IEP team:
Pros of Using a Scatterplot
1. Visual Analysis
- Scatterplots allow you to quickly spot patterns in behavior, such as specific times of day or environments where challenges arise. You can even bring it to IEP meetings to show the data!
- This visual format makes it easier to communicate with IEP teams, administrators, or parents about student progress.
- It can make progress monitoring and reporting easy with being able to report on specifics as well as trends in the data.
2. Saves Time
- Unlike lengthy narrative logs, scatterplots streamline data collection with quick marks on a grid, making it more practical for busy educators.
- Behavior data just feels like one more thing on your plate, but with just making a quick mark on the scatterplot makes it easy to get back your students.
3. Objective and Consistent
- The structured format reduces subjectivity in data collection, making sure that information is clear and unbiased.
- It is an easy way to get all of the iep team members on the same page to be able to track accurately.
4. Supports Data-Driven Decisions
- By identifying trends, scatterplots help you tailor interventions to address behaviors specifically.
- Instead of guessing or using subjective data, you can make decisions based on hard facts.
5. Flexible and Customizable
- You can adapt scatterplots to track a variety of behaviors, settings, or timeframes, making them suitable for diverse needs.
- This can be a tool that isn’t used for just a single student. It can be used for many different students’ needs.
Cons of Using a Scatterplot
1. Limited Context
- Scatterplots show when and where behaviors occur, but they don’t explain the “why.” Additional data or observations may be needed for a full picture.
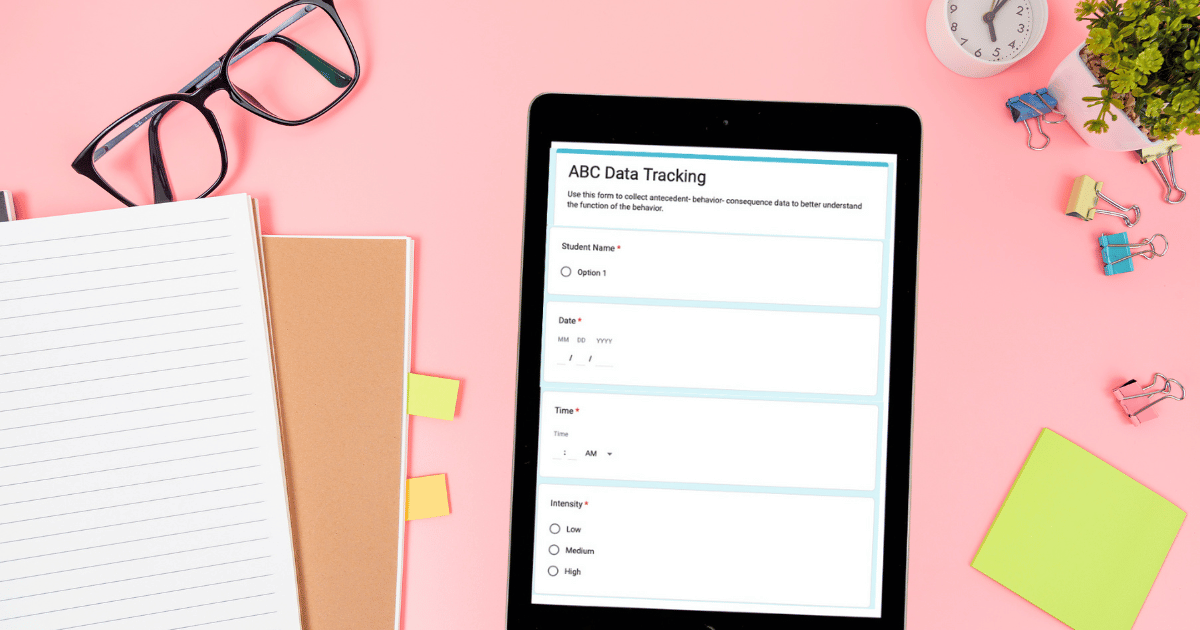
- BUT fear not- I also have a freebie for you. It is a google form to collect ABC data. This can have a pro or con depending on your preference. But feel free to try them both out and see what works best for you and your team.
2. Requires Consistency
- To be effective, scatterplots need to be filled out regularly and accurately, which can feel like an extra task in an already busy day.
- This is why it is important to have specific goals. If you try to target too many behaviors it will also muddy the data and not be consistent.
3. Not Ideal for Complex Behaviors
- For behaviors that vary greatly in intensity or are influenced by subtle triggers, a scatterplot may not capture the nuances.
- This again will most likely require the ABC data form (don’t forget this is free too). But for these behaviors, you may require a FBA and BIP. If you want to learn more about the process with those, read this blog post. This is a great read for all special educators.
- The ABC data form is a free data sheet that is also an editable form that allows you to customize it to your specific student, which is better for complex behaviors.
While scatterplots aren’t a one-size-fits-all solution, they’re an incredibly valuable tool for tracking behavior patterns in a clear, time-efficient way. When paired with additional strategies, they can provide the insight needed to create meaningful and impactful behavior interventions. They can be one of several iep data collection sheets that are in your toolbox.
If you’re looking for a simple, visual way to identify trends, track a student’s progress, and just track data a scatterplot might just be your new favorite tool! Fill out your info below to grab yours today!
Need more behavior help? Check out these other blog posts and tools:
Social Skills Activities for Children with Autism: Learn how to teach social skills to students, which can be causing behaviors in your classroom. Many times behaviors are due to lacking skills.
How to Create Behavior IEP Goals: Now that you have a tool to collect data, maybe you need a better goal to match! This blog is a great way to help you create the perfect behavior goal. Sometimes having different goals allow you to see more progress with a student because they are more specific and observable.
20 Behavior Intervention Strategies: Now you have a goal, some new data sheets, let’s get you some effective behavior interventions. This blog has 20 ideas that will be helpful for an special education classroom. You will get a variety of ways to support your students.
12 Must Have Visual Supports: Visuals are essential tools that will support you with behavior change as well. They are a preventative strategy that can prevent behavior before it even happens. But this is a list of the 12 most important ones.